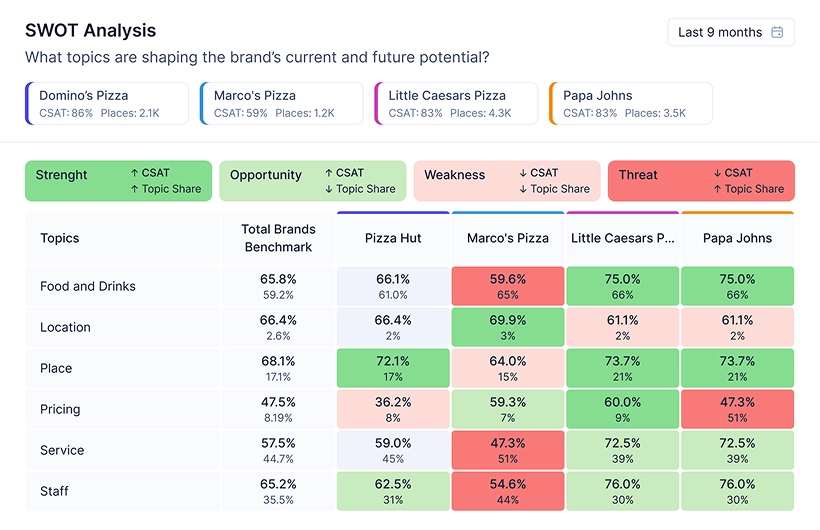
Know your position. Shape your direction
Use SWOT analysis to map where you stand and drive focused operational improvements


Realytics gives you the data to drive better service, faster problem-solving, and tighter control


From 2020

Weekly

200+ countries & territories

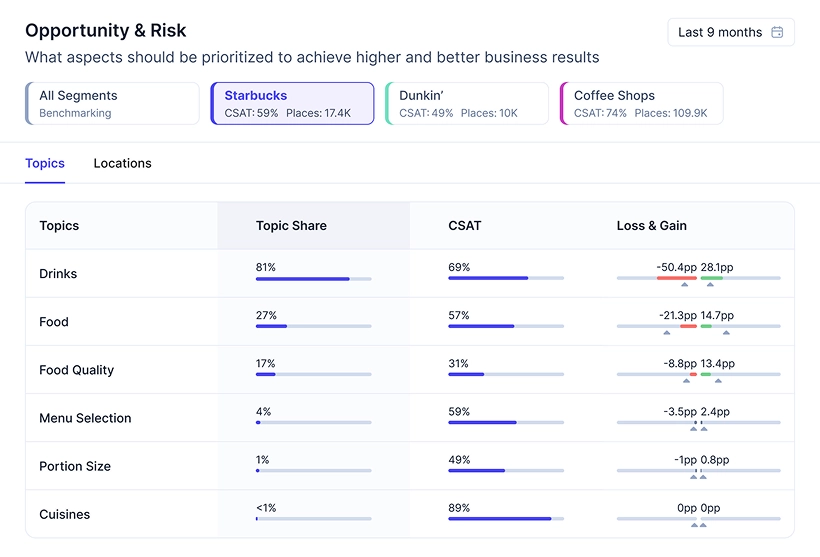
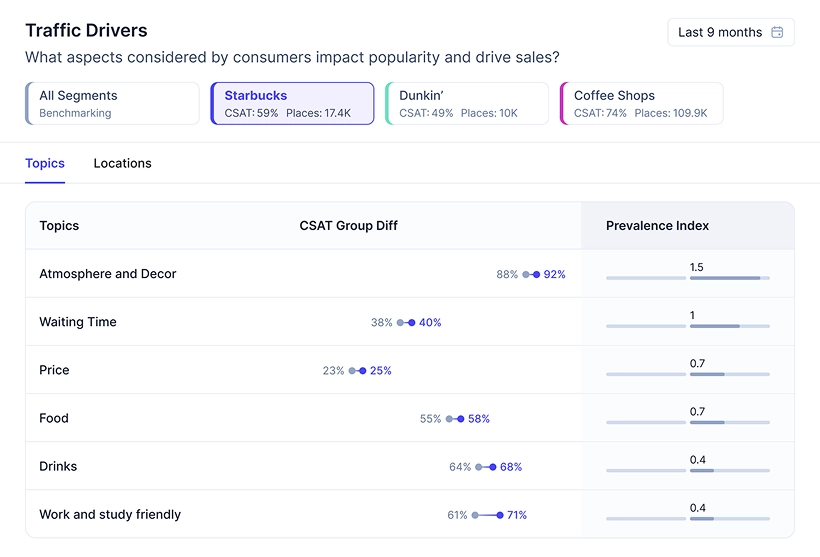
Use SWOT analysis to map where you stand and drive focused operational improvements
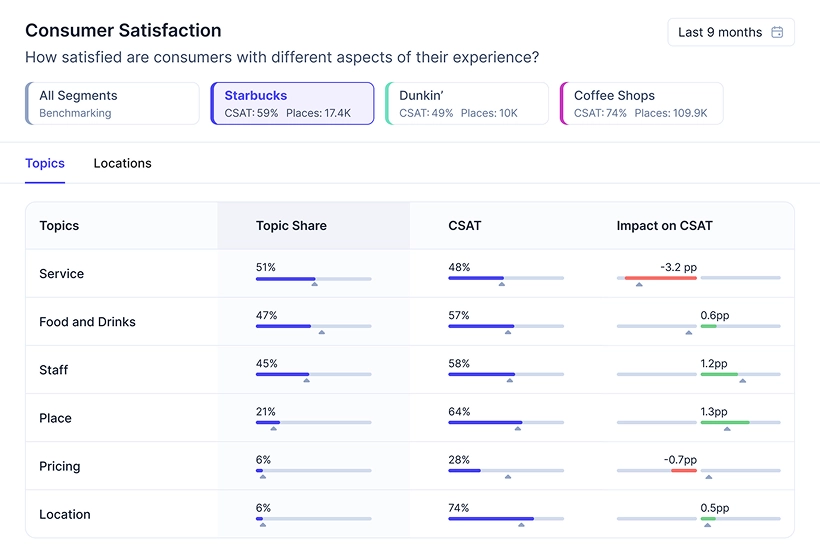
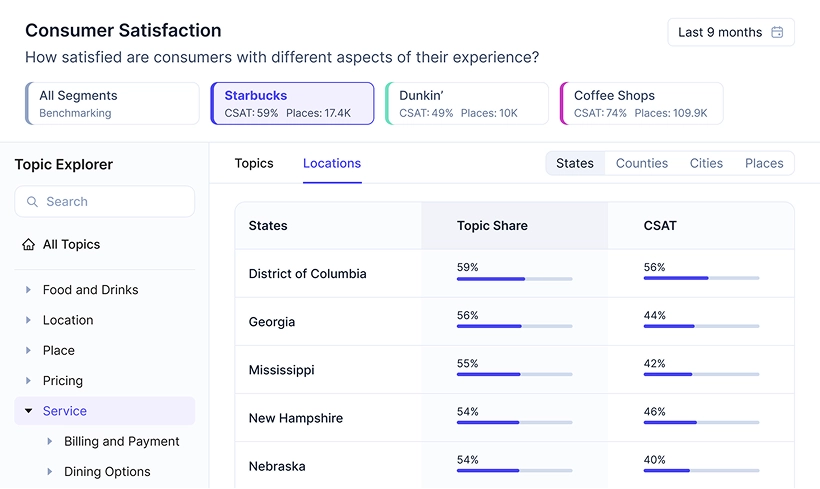
From cleanliness to wait time Realytics breaks it down by topic, impact, and location

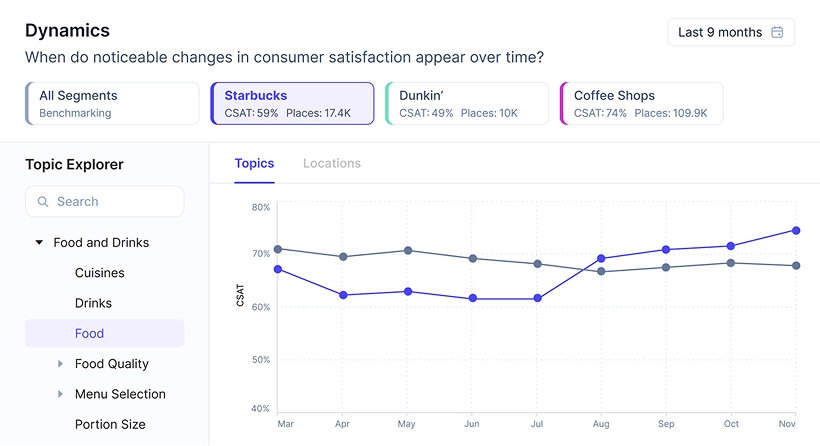
Link every operational tweak to live consumer metrics and watch real-time progress — shift by shift in the Dynamics Report
Quantify potential CSAT swings and focus resources where they create maximum consumer impact
We mapped every store you own against all competitors within a 10-minute walk, then compared foot traffic.
Locations consumers pick more often than nearby rivals are marked Popular; those they skip for competitors are Unpopular
Join us for a demo where we’ll discuss how Realytics can support your business growth and adaptability in changing market conditions