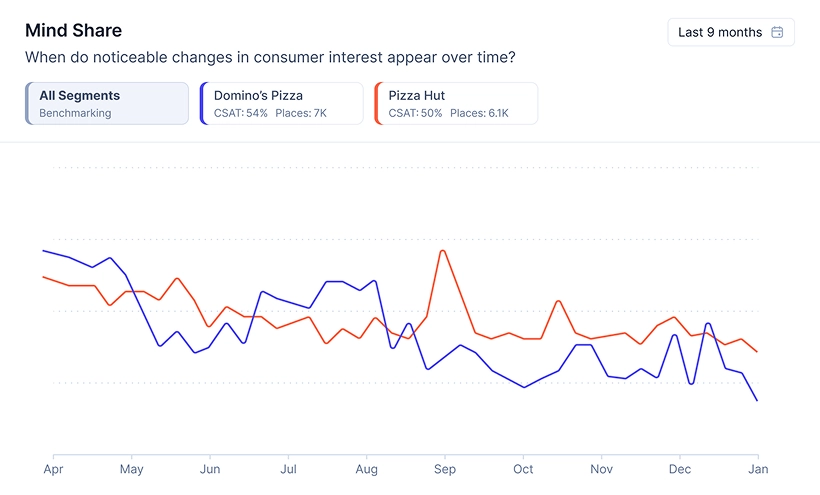
Measure brand interest. Capture mind share
Track the impact of your marketing activities and launches. Benchmark against competitors


Realytics gives you instant brand data to sharpen positioning, strengthen strategy, and win both mindshare & market share


From 2020

Weekly

200+ countries & territories

Track the impact of your marketing activities and launches. Benchmark against competitors
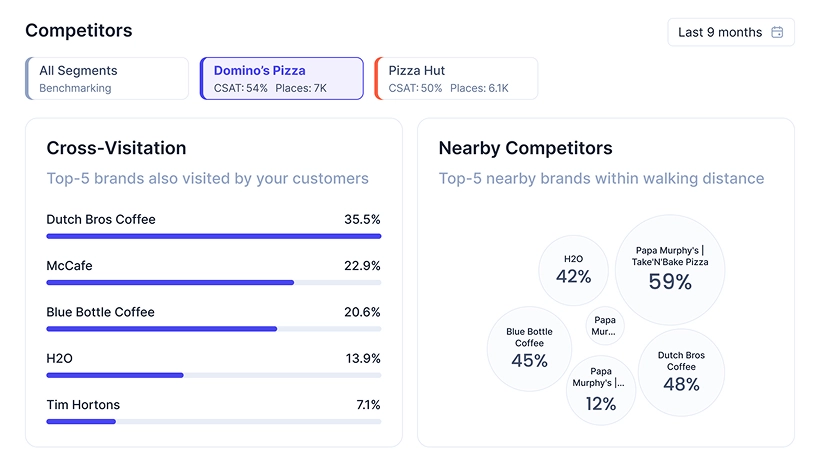
Step beyond interest — see where your consumers really go.
Share of your consumers visiting other brands. Uncover hidden competitors, and adapt your strategy to gain more traffic
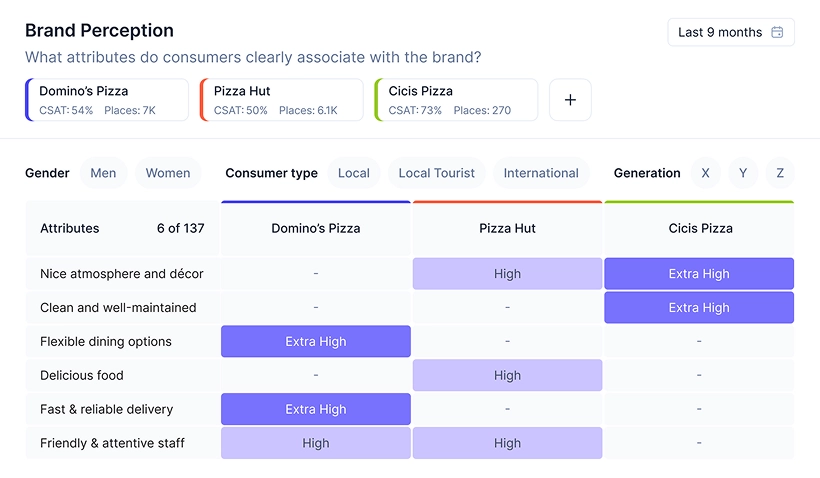
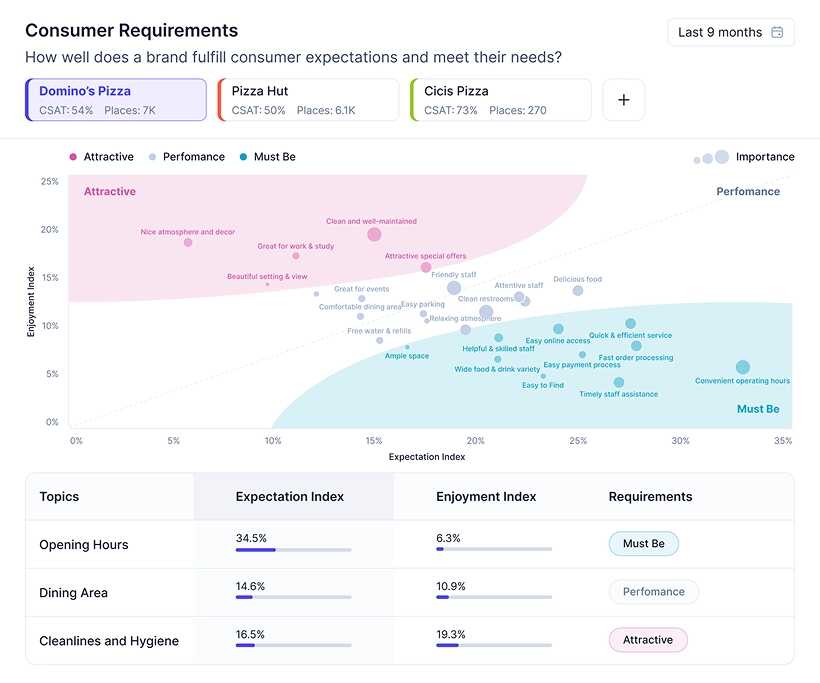
Reveal real strengths and weak spots of your brand and competitors. Understand customer perception of entire segment or category.
Zoom in by consumer type and region
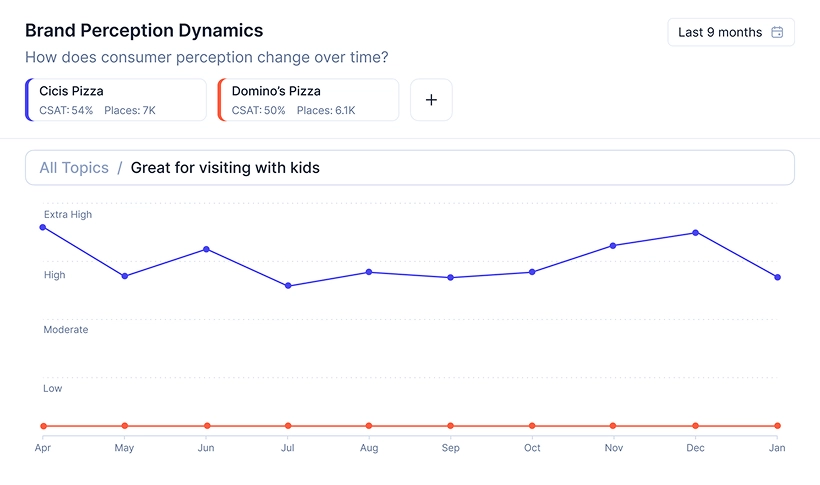
Choose what matters – then monitor perception evolve and link actions to measurable brand impact in the Dynamic Report
Prioritize with clarity: fix what consumers expect by default, strengthen what makes them love you

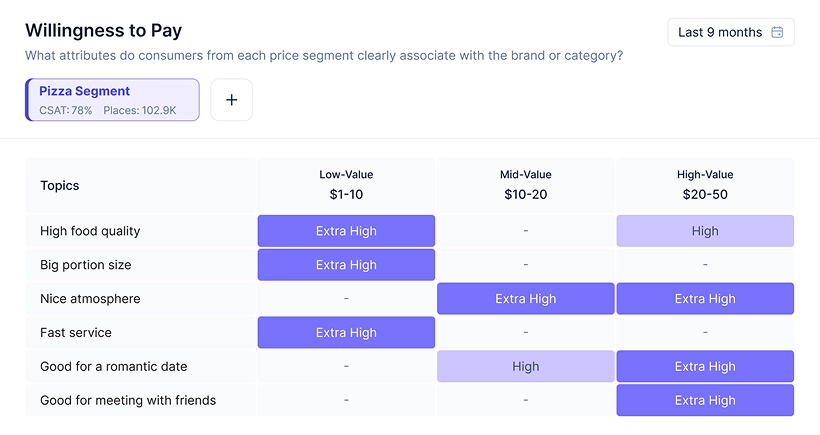
Group consumers by spend, match what they value, and grow margins without guesswork
Join us for a demo where we’ll discuss how Realytics can support your business growth and adaptability in changing market conditions